With imminent changes to reporting of Public Summary Documents, including changes to the publicly available economic (cost-effectiveness) and total financial cost ranges for new drugs recommended for PBS listing by the Pharmaceutical Benefits Advisory Committee (PBAC), KMC Health Care believes it an opportune time to reflect on the types of submissions that have been more readily recommended by the PBAC over the last few years.
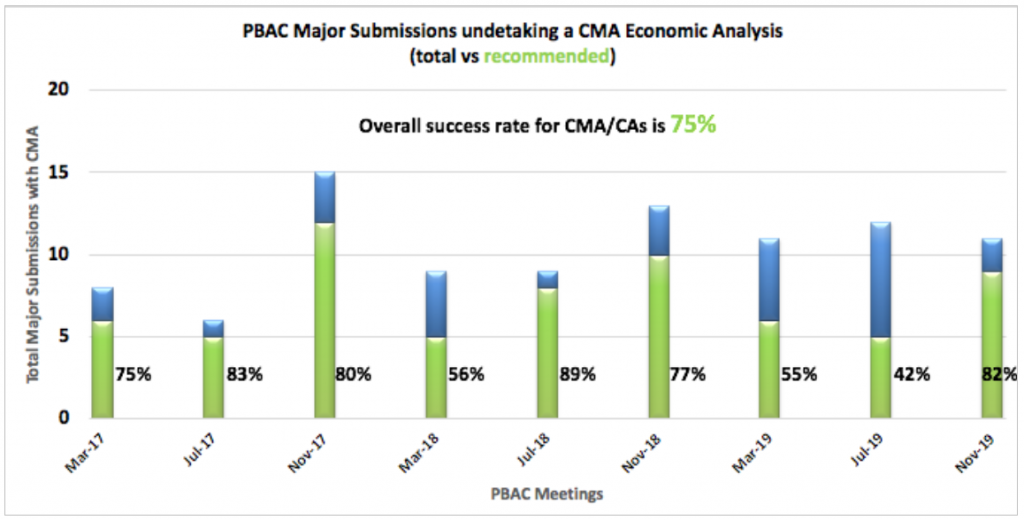
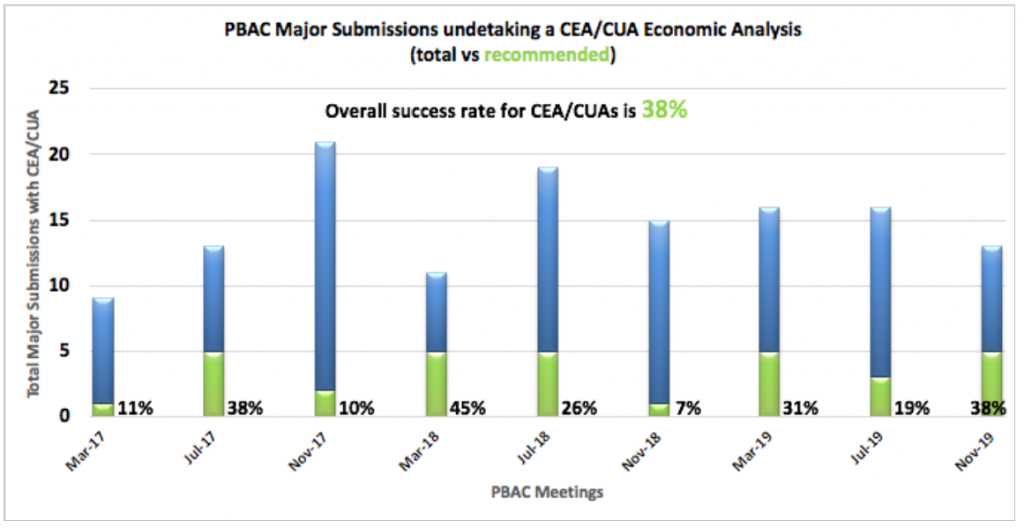
In the following graphs, you will see positive recommendations as a total of all major submissions (excluding deferrals) broken down by Economic Analysis type for each of the PBAC Meeting Cycles for 2017-2019.
Cost Minimisations Analysis (CMA) / Cost Analysis (CA)
CMA/CAs are undertaken when no effectiveness or safety benefit is being claimed (e.g. a similar, ‘me too’ agent) and hence the same or similar price is proposed. As you can see, a submission undertaking a CMA/CA has a far greater chance of success than other types. Between March 2017 and November 2019 PBAC meetings, there has been an overall success rate for CMA/CAs presented to the PBAC of 75%.

Cost Effectiveness (CEA) / Utility Analyses (CUA)
CEA/CUAs are required when a clinical effectiveness and/or safety benefit is being claimed, with a premium price over the proposed comparator. As you can
see from the graph, CEA/CUA submissions have a dramatically lower rate of success at the PBAC. No individual PBAC Meeting has recorded more than five positive recommendations using the CEA/CUA method in this 3-year period, with the overall success rate of only 38%.
With the reporting changes proposed, we will hopefully start to see greater transparency in the CEA/CUA submissions in terms of smaller ICER reporting ranges. The other proposed changes currently being trialled include the more detailed breakdown of patient numbers and net financial impact ranges. All these changes are due for implementation from the 2020 July PBAC Meeting Cycle.

The following changes have been proposed –
ICE/QALY ranges
- Dominant (i.e. cost saving and health improving),
- $0-<$5,000, then
- $10,000 range increments to $55,000, i.e. $5,000 – < $15,000, $15,000 – < $25,000, etc., then
- $20,000 range increments to $155,000, i.e. $55,000 – < $75,000, $75,000 – < $95,000, etc., then
- $100,000 range increments thereafter, i.e. $155,000 – < $255,000, $255,000 – < $355,000 etc. – with no upper limit.
Estimated patient numbers (adding “per year” if estimating annual incidence rather than prevalence)
- < 500 (reflecting the Life Saving Drugs Program’s current definition of rare disease being a prevalence of 1 in 50,000 and an Australian population of 25 million),
- 500 – < 5,000, then
- 5,000 – < 10,000, then>
- 10,000 increments, i.e. 20,000 – < 30,000, 30,000 – < 40,000, etc. – with no upper limit
Estimated net financial implication ranges
-
- Net cost saving,
- $0-<$10million per year, then
<li$10 million per year increments, i.e. $10 million – < $20 million, $20 million – < $30 million, etc. – with no upper limit.
Source: Draft Procedure Guidelines for Public Summary Document as per PBS website.
